
Analytics is a useful tool to help you analyze user actions on the website and get new leads. Is that good or bad, we live in a data age where facts and numbers say a lot. But simply collecting raw data is not enough. Properly implemented analytics will show you how to find gaps in the page design and content you use. Let’s talk about Google Analytics and User Experience (UX).
Google Analytics and UX: what should you know?

A few words about difficult things you may face. Google Analytics (GA) is a service from Google designed to help businesses understand user actions on websites and achieve their goals (get more new leads, sell products or services, etc.). It gives accurate and right information about user’s behavior, helps track conversion and allows to detect non-obvious problems in the field of user experience. Google recently announced the new Google Analytics 4 (GA 4). This is a new version that gives more useful data that helps improve the user experience.
Why is UX so important today? Let’s say, you have a website and a potential lead, who visited your website. You need the website to match its user’s needs and help the user to solve a problem. An ability to reach the right audience with the right instruments helps to attract new leads. And with Google Analytics you may improve website UX and increase conversion rate.
How can Google Analytics help?

There are three simple answers:
- Analytics strengthens your communication strategy. Thanks to analytics, you can compare previous and new content, see the gaps and improve the ways of reaching your target audience. This helps to plan a long term content strategy.
- Analytics shows your weaknesses. By knowing what you can improve, you can change the content or update goals. The website should look as functional as possible for users and it should have clear calls to action – buying a service, requesting a call, filling out a form.
- You don’t need to guess, just track results. Constantly analyzing and documenting changes in user behavior is critical for understanding how good your website is. Knowledge of analytics data will make it easier to build a goal and attract new leads.
What do you need to know to improve your website?
Google Analytics may seem like a complex tool, but it provides a huge amount of data. Let’s start with the main metrics you need to understand how good your website is.
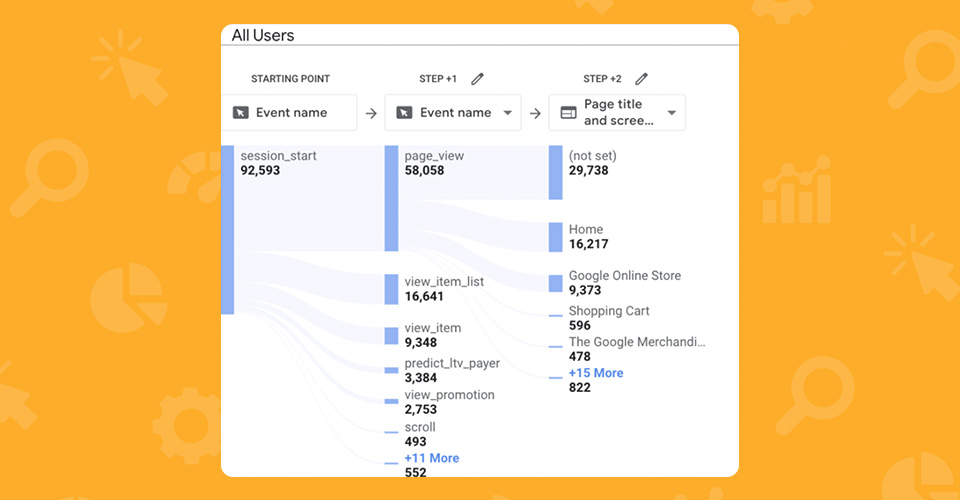
User journeys
How does the user get to the website? What is he interested in? Where does he leave the website and why? Analytics will tell you everything about your potential client and even a little more. Depending on the data received, you will be able to identify possible problems on the website and improve its interface.
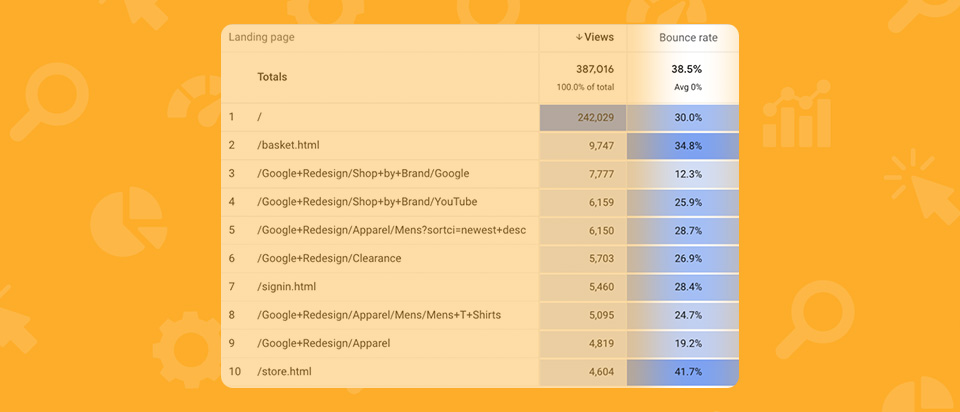
Bounce rates
This metric will tell you how many customers have visited your website without clicking anywhere. You can get two results – high bounce rate and low bounce rate. You need to strive to keep the bounce rate low, but sometimes it can be high. A high rate means that visitors leave your website without any action and that should be considered as weakness. For example, if you publish an article in your blog without any call to action, people will read the article and leave. But you can always improve the blog by adding a subscription button, demo request or an offer to buy a product.
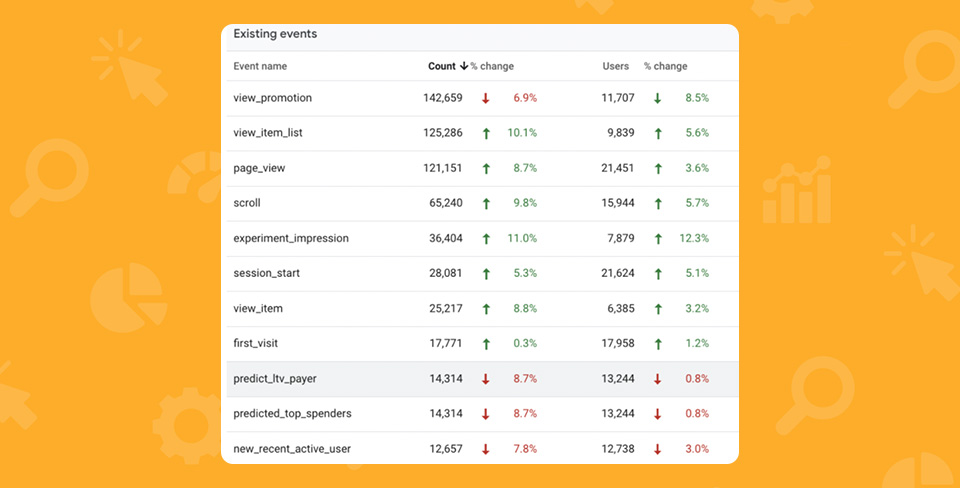
Event Tracking
Event Tracking is another great tool in Google Analytics. It allows you to track activities that are otherwise invisible. This tool helps track specific clicks, such as buttons, links, navigation, etc. This will help to understand whether you have chosen a good button or not, whether the strategy is successful, or you need to work on it.
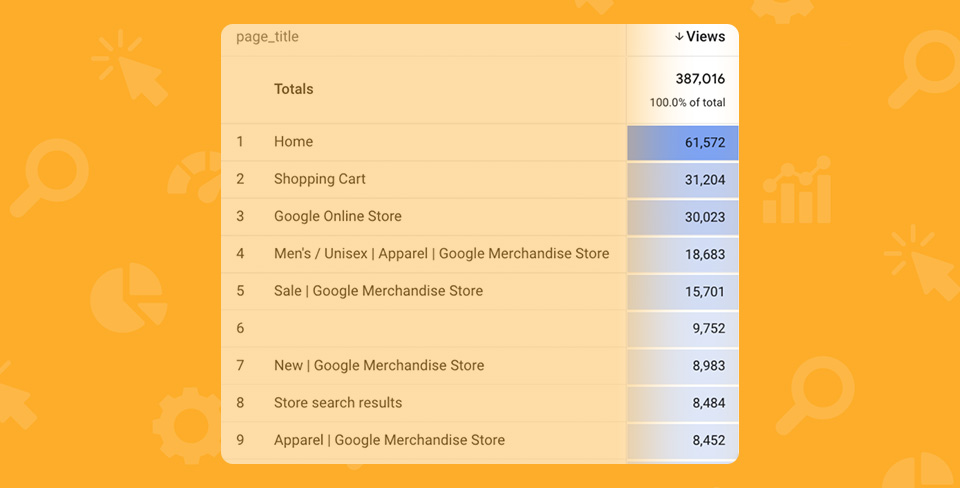
Pageviews
How many visitors does your website have? Look at the page view metric. There are two important things – page views and unique page views. If you compare them, you can understand whether visitors re-read the content on the website or not. Knowing this information will help you understand the usefulness of data you give to customers.
Time on Page
This metric allows you to understand the amount of time spent by a visitor on your website. It also shows how long it takes him to complete the target action. It's good when people stay on the website for a long time with a large article or questionnaire. This means that the content is interesting. But don’t forget about a call to action to keep a low bounce rate. Otherwise, an informational article is no use for you since your goal is to get new leads.
What do you need to get started with analytics?
There are a lot of metrics and indicators that need to be tracked but there is one way to do it quickly and efficiently. Naranga team can help not only to connect Google Analytics to the website, but also to track all the indicators for you and improve your website’s performance. If you already use GA, we can do a free audit of your website to see what can be changed to get more leads in your lead management system.
Learn how to take the best out of your franchise website with our help. Contact us here or reach out at info@naranga.com.